Customer Acquisition Cost (CAC): How to Calculate, Reduce, and Benchmark Yours
Customer acquisition cost averages $606 across industries. Learn how to calculate your CAC, compare it to benchmarks, and reduce it with 5 proven steps.

In This Article
$0–$50
Est. Cost
30 minutes
Timeline
5
Total Steps
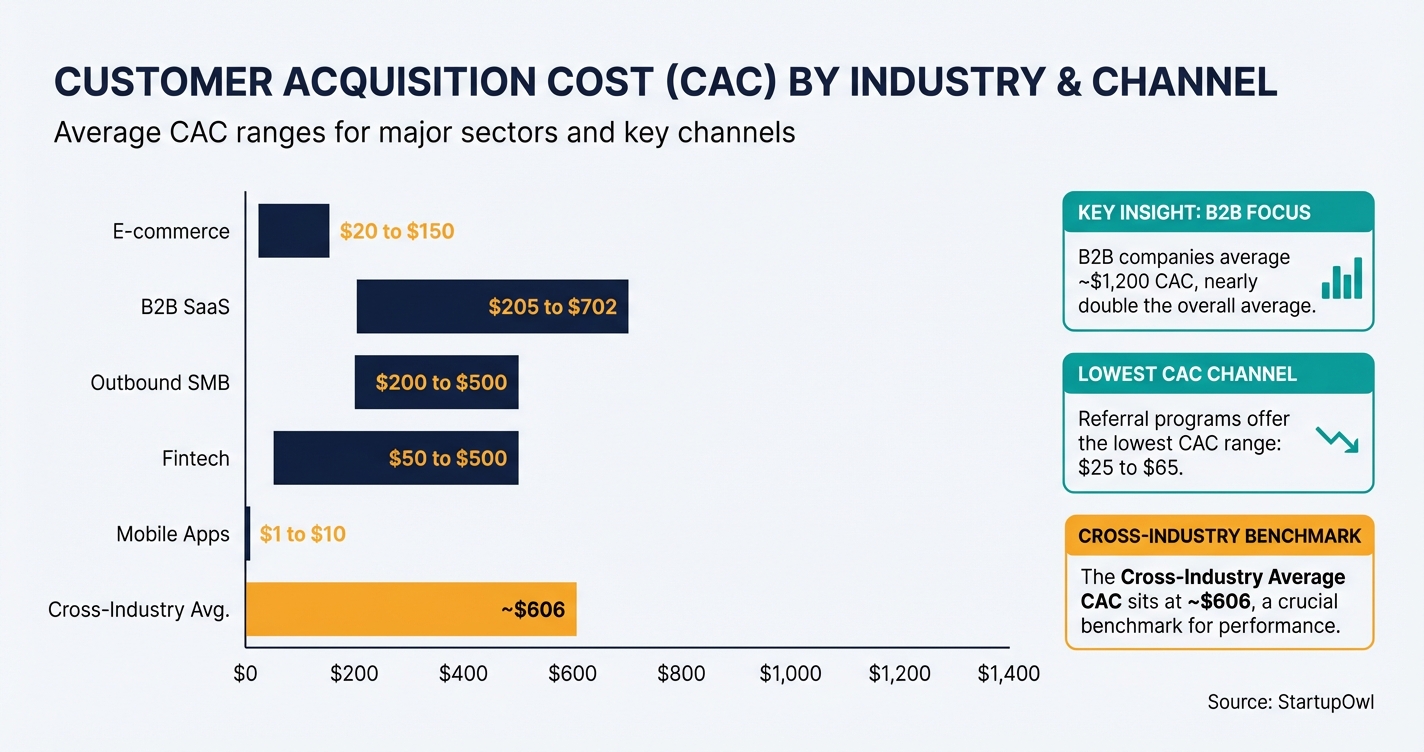
The average customer acquisition cost across all industries hovers around $606, but B2B companies pay nearly double that at roughly $1,200 per new customer. E-commerce businesses, by contrast, can acquire customers for as little as $20 to $150 depending on the vertical. These numbers only mean something if you know yours.
Most small business owners drastically underestimate their CAC because they only count ad spend and ignore salaries, tools, and overhead. That mistake can make unprofitable channels look viable and lead to burned budgets. This guide gives you the exact formula, real benchmark data for 2026, and a step-by-step process to calculate, compare, and reduce your own customer acquisition cost.
What Customer Acquisition Cost Actually Measures
Customer acquisition cost (CAC) is the total amount you spend on sales and marketing to gain one new paying customer. The formula is simple: divide all your sales and marketing costs by the number of new customers acquired in the same period. If you spent $10,000 in a quarter and gained 50 new customers, your CAC is $200.
The key word is all costs. That means paid advertising on Google, Meta, and LinkedIn, but also content marketing (writers, designers, SEO tools), marketing and sales software subscriptions, team salaries and commissions, agency fees, events, sponsorships, and PR spend. Only counting your ad bill is the single most common CAC mistake, and it can underestimate your real number by 50% to 300%.
CAC matters because it feeds directly into your unit economics. When you pair it with customer lifetime value (LTV), you can tell whether your business model is profitable on a per-customer basis. A healthy LTV-to-CAC ratio is at least 3:1, meaning every dollar you spend acquiring a customer produces at least three dollars in lifetime gross profit. If your ratio is below 1:1, you are losing money on every customer you acquire.
How to Calculate Your CAC in 5 Steps
Follow these steps to calculate your real, fully loaded customer acquisition cost. You can do this with a free spreadsheet and Google Analytics 4 (which is completely free for small and mid-sized businesses as of 2026). No paid tools required.
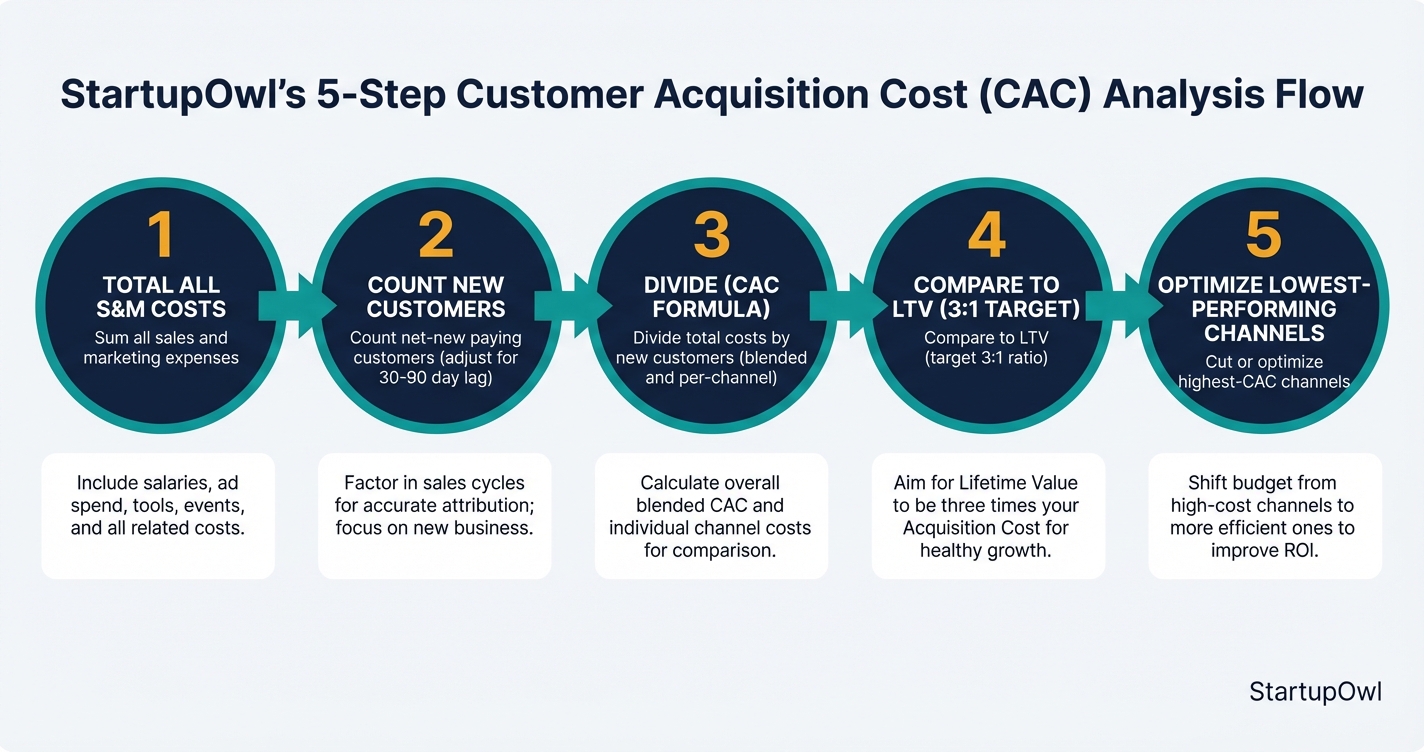
Step 1. Add up every sales and marketing expense for a defined time period (a quarter works best). Include ad spend, salaries, commissions, software subscriptions, agency fees, content production costs, events, and overhead allocated to marketing.
Step 2. Count your net-new paying customers acquired in that same period. Exclude returning customers, upsells, and free trial users who never converted. Adjust for your typical 30 to 90 day sales cycle so you're matching spend to the period when leads actually convert.
Step 3. Divide total costs by new customers acquired. That's your blended CAC. Then calculate a separate CAC for each channel (Google Ads, Meta, SEO, referrals, email, etc.) to find your most and least efficient sources.
Step 4. Compare your CAC to your customer lifetime value. Calculate your LTV-to-CAC ratio (target 3:1 or better) and your CAC payback period (target 12 months or under). High-performing SaaS companies achieve payback in 5 to 7 months.
Step 5. Identify your highest-CAC channels and either optimize or reallocate budget to lower-CAC sources like referrals ($25 to $65 per customer) and content marketing/SEO ($10 to $100 at maturity). Build your plan using our free marketing plan template.
2026 CAC Benchmarks by Industry and Channel
| Type / Provider | Rate | Notes |
|---|---|---|
| E-commerce (Fashion) | $20 – $100 | Lower CAC but requires high volume for profitability |
| E-commerce (Beauty) | $30 – $80 | Strong referral and influencer channel performance |
| E-commerce (Electronics) | $50 – $200 | Higher price points justify higher acquisition spend |
| B2B SaaS | $205 – $702 | Varies by segment; longer sales cycles increase costs |
| Outbound Sales (SMB) | $200 – $500 | Includes SDR salaries and outreach tools |
| Outbound Sales (Mid-Market) | $500 – $2,000 | Multiple decision-makers extend the sales cycle |
| Outbound Sales (Enterprise) | $2,000 – $10,000+ | RFP processes and high-touch sales drive costs up |
| Fintech | $50 – $500 | Regulatory requirements and trust-building increase CAC |
| Mobile App Installs | $1 – $10 | Cheapest CAC but often lowest LTV per user |
| Subscription Apps | $20 – $100 | Conversion from free to paid is the key lever |
| Content Marketing / SEO (Mature) | $10 – $100 | Takes 6 to 12+ months to mature but compounds over time |
| Referral Programs | $25 – $65 | Consistently the cheapest acquisition channel |
| LinkedIn Ads | ~$982 | High cost per lead; best for high-ACV B2B products |
| Cross-Industry Average | ~$606 | B2B companies average roughly $1,200 due to longer sales cycles |
Best Free and Low-Cost Tools for Tracking CAC
You do not need expensive software to track your customer acquisition cost. These three tools handle the job for most small businesses, and all of them have generous free tiers.
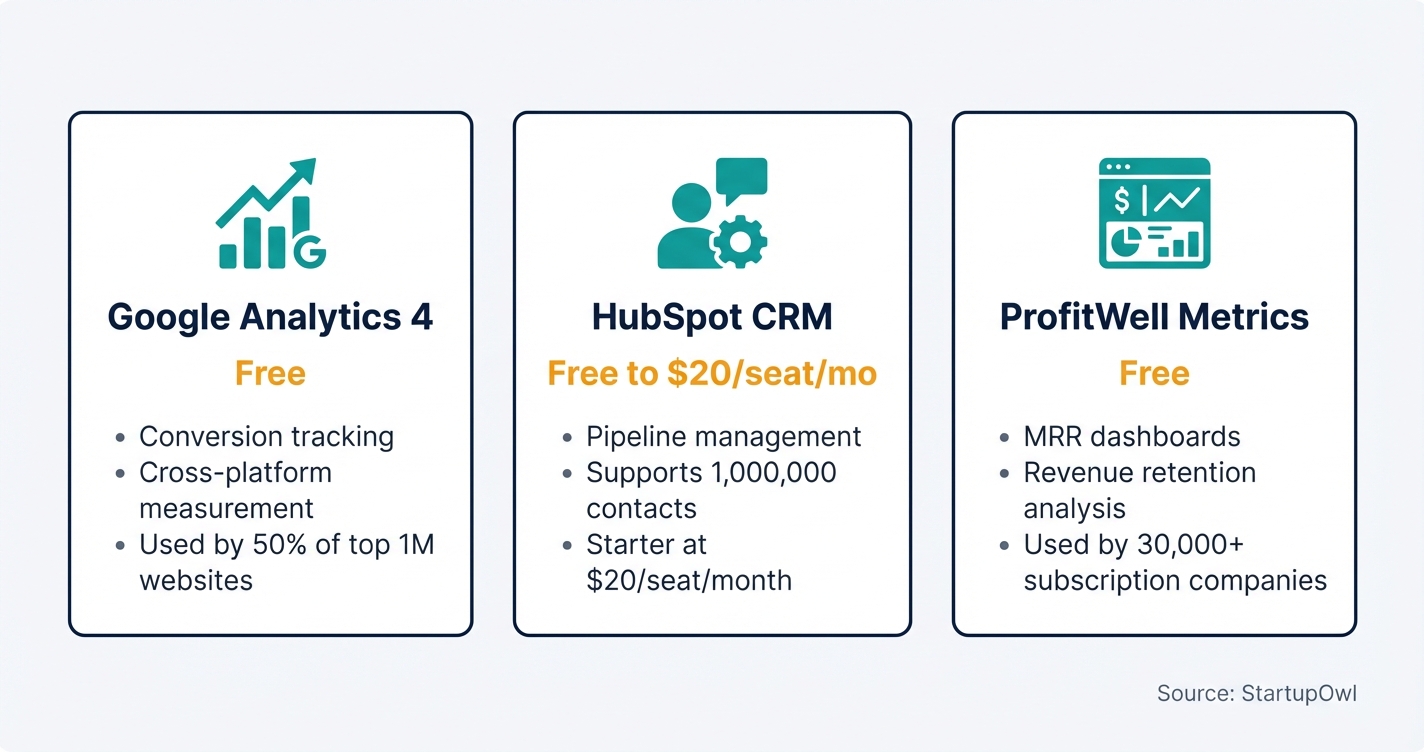
Google Analytics 4 is completely free and tracks where your website visitors come from, how they behave, and when they convert. As of 2026, it's used by roughly 50% of the top million websites. GA4 gives you acquisition data, conversion tracking, and audience segmentation at no cost. The enterprise version (GA360) starts at about $50,000/year, but you won't need it until you're processing billions of events.
HubSpot CRM offers a free plan that supports up to 1,000,000 contacts with no time limit, along with basic deal tracking, email tracking, and pipeline management for up to 2 users. When you outgrow the free plan, the Starter tier starts at $20/seat/month as of 2026. HubSpot connects your marketing spend to actual closed deals, which is critical for accurate CAC tracking. See our CRM for startups guide for more options.
ProfitWell Metrics by Paddle is a free subscription analytics tool used by over 30,000 companies (including Canva, Autodesk, and Notion). It connects to your billing system (Stripe, Recurly, Chargebee, and others) and gives you real-time MRR, churn, and unit economics dashboards. If you run a subscription business, ProfitWell shows your CAC payback period automatically.
Start With a Spreadsheet Before You Buy Software
A Google Sheets CAC tracker with one tab per channel and monthly rows for spend, new customers, and per-channel CAC is enough for most businesses under $50,000/month in marketing spend. You can always upgrade to HubSpot or a dedicated analytics platform later. Start simple, track consistently, and upgrade when your data volume justifies the cost.
5 CAC Mistakes That Cost Small Businesses Real Money
1. Only counting ad spend. If you track just your Google or Facebook ad bill, you're ignoring salaries, tools, content production, and overhead. This can understate your real CAC by 50% to 300%, making unprofitable channels look viable. Include every dollar that touches the sales and marketing function.
2. Ignoring the time lag between spending and conversions. Most B2B sales cycles run 30 to 90 days. If you match January's spend to January's conversions, you'll misattribute performance. One documented example showed a channel's CAC of $148 dropped to $84 when the 60-day lag was properly accounted for. Without this adjustment, you might cut a channel that's actually working.
3. Never segmenting CAC by channel. A blended CAC tells you your average cost, but it hides which channels are printing money and which are draining it. Referral programs produce CAC of $25 to $65. LinkedIn Ads average around $982. You need per-channel data to make smart budget decisions. Our small business marketing plan guide walks through channel-level budgeting.
4. Not comparing CAC to lifetime value. A $500 CAC is perfectly fine if your customer's LTV is $2,000. It's a disaster if your LTV is $400. Always calculate your LTV-to-CAC ratio. The benchmark is 3:1. If yours is below 1:1, you're losing money on every customer you acquire. Use cost-plus pricing principles to improve margins and boost LTV.
5. Setting CAC once and never revisiting it. CAC shifts with seasonality, channel performance, hiring changes, and pricing adjustments. Recalculate at least once per quarter. Track the trend line, not just the snapshot. A rising CAC that's still below your threshold is more concerning than a stable but slightly higher number.
What to Do This Week
Open a spreadsheet, pull last quarter's total sales and marketing spend, count your new paying customers, and divide. That gives you your blended CAC in under an hour. Then break it down by channel. Compare your numbers to the benchmarks in the table above, and check that your LTV-to-CAC ratio hits at least 3:1.
If you're early and don't have enough data yet, start by installing Google Analytics 4 (free) and setting up UTM parameters on every campaign link. Once you have 90 days of data, you can run a meaningful CAC calculation. Grab our free marketing plan template to structure your first small business marketing plan around actual per-channel acquisition economics.
Step-by-Step Process
- 1
Add up every sales and marketing expense
Pull together every dollar your business spends on acquiring customers. That includes paid advertising on Google, Meta, and LinkedIn, content marketing costs (writers, designers, SEO tools), marketing software subscriptions, sales team salaries and commissions, CRM software, events, sponsorships, and agency fees.
The most common mistake at this step is counting only ad spend. If you track just your Google Ads bill and ignore salaries, tools, and overhead, you could underestimate your true CAC by 50% to 300%. Use a spreadsheet or your accounting software to total every line item for a specific time period (monthly or quarterly works best).
Tips
- Include overhead costs like a portion of office rent allocated to sales and marketing teams
- Pull numbers from your accounting system rather than estimating from memory
- Separate one-time costs (like a website redesign) from recurring acquisition spend
Common Mistakes
- Only counting ad spend and forgetting salaries, tools, and agency fees
- Mixing product development costs into your marketing total
- 2
Count new customers acquired in the same period
Count only net-new paying customers gained during the same time window you used for your expenses. Returning customers, upsells, and upgrades do not count. If you spent $10,000 in Q1 on marketing and sales, and you acquired 50 new paying customers in Q1, those are your two numbers.
Account for the time lag between spending and conversion. If your typical sales cycle is 60 days, a dollar spent in January may not convert until March. One case study showed a CAC of $148 using same-month math that dropped to $84 when the 60-day sales cycle was properly aligned. Your CRM or Google Analytics 4 can help you track conversion timelines.
Tips
- Use cohort-based tracking to align your spend with the month customers actually converted
- Exclude free trial users who never converted to paid
Common Mistakes
- Matching same-month spend to same-month conversions without adjusting for the 30 to 90 day sales cycle
- Counting free trial signups as acquired customers
- 3
Run the CAC formula and segment by channel
Divide your total sales and marketing costs by the number of new customers acquired. That gives you your blended CAC. If you spent $15,000 across all channels and gained 100 new customers, your blended CAC is $150.
Now break that number down by channel. Calculate a separate CAC for Google Ads, Meta Ads, SEO/content, referrals, email, and any other source. Referral programs typically produce the lowest CAC ($25 to $65), while LinkedIn Ads can push CAC close to $982. Without per-channel numbers, you can't tell which channels are profitable and which are burning cash. Check out our Google Ads for small business guide for channel-specific tactics.
Tips
- Set up UTM parameters for every campaign so you can attribute customers accurately
- Build a simple spreadsheet with one tab per channel for monthly tracking
- Recalculate quarterly to spot seasonal trends
Common Mistakes
- Tracking only blended CAC across all sources and never calculating per-channel numbers
- 4
Compare your CAC to your customer lifetime value
A high CAC is not inherently bad. What matters is your LTV-to-CAC ratio. The widely accepted benchmark across industries is 3:1, meaning every dollar you spend on acquisition should generate at least three dollars in lifetime gross profit. If your ratio dips below 3:1, you're spending too aggressively. If it's above 5:1, you're likely under-investing in growth and giving competitors an opening.
You should also calculate your CAC payback period (how many months until a new customer's revenue covers their acquisition cost). The general benchmark for startups is 12 months or less. High-performing SaaS companies hit 5 to 7 months. If you sell subscriptions, use this formula: CAC divided by (monthly revenue per customer multiplied by gross margin). You can use our pricing calculator to model different scenarios.
Tips
- Calculate LTV by multiplying average annual customer margin by average customer lifespan in years
- Segment LTV by customer type (enterprise versus small business) for more actionable insights
Common Mistakes
- Ignoring the LTV-to-CAC ratio entirely and panicking over a high absolute CAC number
- Using revenue instead of gross profit when calculating LTV
- 5
Reduce your CAC with the highest-leverage changes first
Start with the channel that has the worst per-channel CAC relative to its LTV and either optimize or cut it. Shift budget toward your lowest-CAC channels. Referral programs ($25 to $65 CAC) and mature content marketing/SEO ($10 to $100 CAC) typically outperform paid channels over time. Build your small business marketing plan around these economics.
Improve conversion rates at each stage of your funnel. Even a modest improvement (say, landing page conversion from 2% to 3%) drops your CAC by roughly 33% without increasing spend. Invest in local SEO and building a brand to create compounding organic traffic that lowers your blended CAC every month. Consider ChatGPT for small business to produce content faster and cut creation costs.
$0 to $500/month depending on tools used Ongoing (expect 3 to 6 months for meaningful improvement) HubSpotTips
- Launch a referral program before increasing ad spend since referrals produce the cheapest CAC
- A/B test landing pages, email subject lines, and ad creative to lift conversion rates
- Invest in content marketing early because initial CAC is high but mature SEO delivers $10 to $100 CAC
Common Mistakes
- Cutting a channel that looks expensive on a same-month basis but is actually profitable over a 60-day sales cycle
Cost Breakdown
| Item | Cost Range | Notes |
|---|---|---|
| Google Analytics 4 (tracking and attribution) | $0 | Free for most businesses. Enterprise version (GA360) starts at $50,000/year. |
| HubSpot CRM (tracking CAC, sales pipeline) | $0 to $20/month | Free plan supports up to 1,000,000 contacts. Starter plan is $20/seat/month as of 2026. |
| ProfitWell Metrics by Paddle (subscription analytics) | $0 | Free subscription metrics dashboard. Paid Retain product charges only on recovered revenue. |
| Spreadsheet-based CAC tracker | $0 | Google Sheets is free. Works for most small businesses doing manual tracking. |
| Paid analytics tools (Mixpanel, Amplitude, etc.) | $0 to $1,000+/month | Free tiers available. Paid plans needed for advanced cohort analysis and larger data volumes. |
Frequently Asked Questions
There's no single "good" CAC because it depends on your customer lifetime value. The real metric to watch is your LTV-to-CAC ratio, which should be at least 3:1. For context, e-commerce businesses typically see CAC of $20 to $150, while B2B SaaS companies average $205 to $702.
Divide your total sales and marketing costs by the number of new customers acquired in the same period. Include ad spend, salaries, commissions, tools, content production, and agency fees. If you spent $15,000 in a quarter and gained 100 new customers, your CAC is $150.
It measures how much lifetime gross profit each customer generates relative to what you spent to acquire them. A 3:1 ratio is the widely accepted benchmark, meaning $3 in profit for every $1 in acquisition cost. Below 1:1 means you're losing money on every customer. Above 5:1 may mean you're under-investing in growth.
The general benchmark for startups is 12 months or less. High-performing SaaS companies achieve CAC payback in 5 to 7 months. Enterprise-focused businesses with high contract values may take 18 to 24 months, which is acceptable if customer retention is strong enough to justify it.
Referral programs consistently produce the lowest CAC at $25 to $65 per customer. Content marketing and SEO can also reach $10 to $100 per customer once they mature, but they take 6 to 12+ months of investment before reaching those levels. Paid channels like LinkedIn Ads average around $982 per acquisition.
Yes. Include the salaries and benefits of everyone involved in sales and marketing, plus their tools and a proportional share of overhead. Excluding salaries is the top reason small businesses underestimate their CAC by 50% to 300%. If someone spends half their time on sales, count half their compensation.
Some links on this page are affiliate links. If you sign up for a service through them, we may earn a commission at no extra cost to you. This does not influence our rankings.
Sources & References
- Harvard Business School Online: LTV/CAC Ratio Guide
- HubSpot Pricing Page (2026)
- Google Analytics 4: Official Documentation
- Geckoboard: CAC Payback Period KPI Benchmark
- Geckoboard: LTV:CAC Ratio KPI Benchmark
- First Page Sage: LTV to CAC Ratio Benchmark
- ProfitWell Metrics by Paddle (G2 Pricing Page)
- Phoenix Strategy Group: CAC Benchmarks by Industry
- Capterra: HubSpot CRM Pricing
- PostHog: How Much Does Google Analytics Cost
- FTC Endorsement Guides
About the Author
Digital Marketing Expert
Sofía cut her teeth working at a mid-sized digital marketing agency in Miami, managing multi-channel campaigns for local e-commerce and service businesses. She speaks the language of customer acquisition costs, conversion rates, and SEO optimization fluently.
Was this article helpful?
Questions about Customer Acquisition Cost (CAC)
No comments yet. Ask the first question and a member of our team will answer.
Leave a comment