How to Create Financial Projections for a Startup: Templates and Step-by-Step Guide
Learn how to create financial projections for your startup in 7 steps. Free templates, 3-5 year forecasting methods, and the exact documents investors expect.

In This Article
- Key Takeaways
- Step-by-Step
- Cost Breakdown
- What Financial Projections Are and Why They Matter
- Who Needs Financial Projections (and When)
- Step-by-Step Process to Build Your Financial Projections
- What It Costs to Create Financial Projections
- Best Free Templates and Where to Download Them
- What to Do If You Can't Build Projections on Your Own
- 5 Projection Mistakes That Kill Funding Pitches
- FAQ
$0–$2,000
Est. Loan Cost
168 hours
Timeline
7
Total Steps
Your financial projections are the single most scrutinized section of your business plan. Investors and lenders use them to decide whether your startup is worth backing, and 82% of businesses that fail cite cash flow problems as a factor. If your projections are sloppy (or missing), your funding pitch is dead on arrival.
The good news: you don't need a finance degree. You need three core financial statements, realistic assumptions grounded in market data, and a willingness to update your numbers quarterly. This guide walks you through the entire process in 7 actionable steps, with free templates and specific tool recommendations at every stage.
Whether you are building projections to get a business loan, pitch angel investors, or simply plan your first year of operations, you will find exactly what you need below.
What Financial Projections Are and Why They Matter
Financial projections are forward-looking estimates of your startup's income, expenses, and cash position over a specific period (typically 3 to 5 years). They combine your sales forecasts, expense budgets, and balance sheet estimates into a complete financial picture that helps you plan internally and pitch externally.
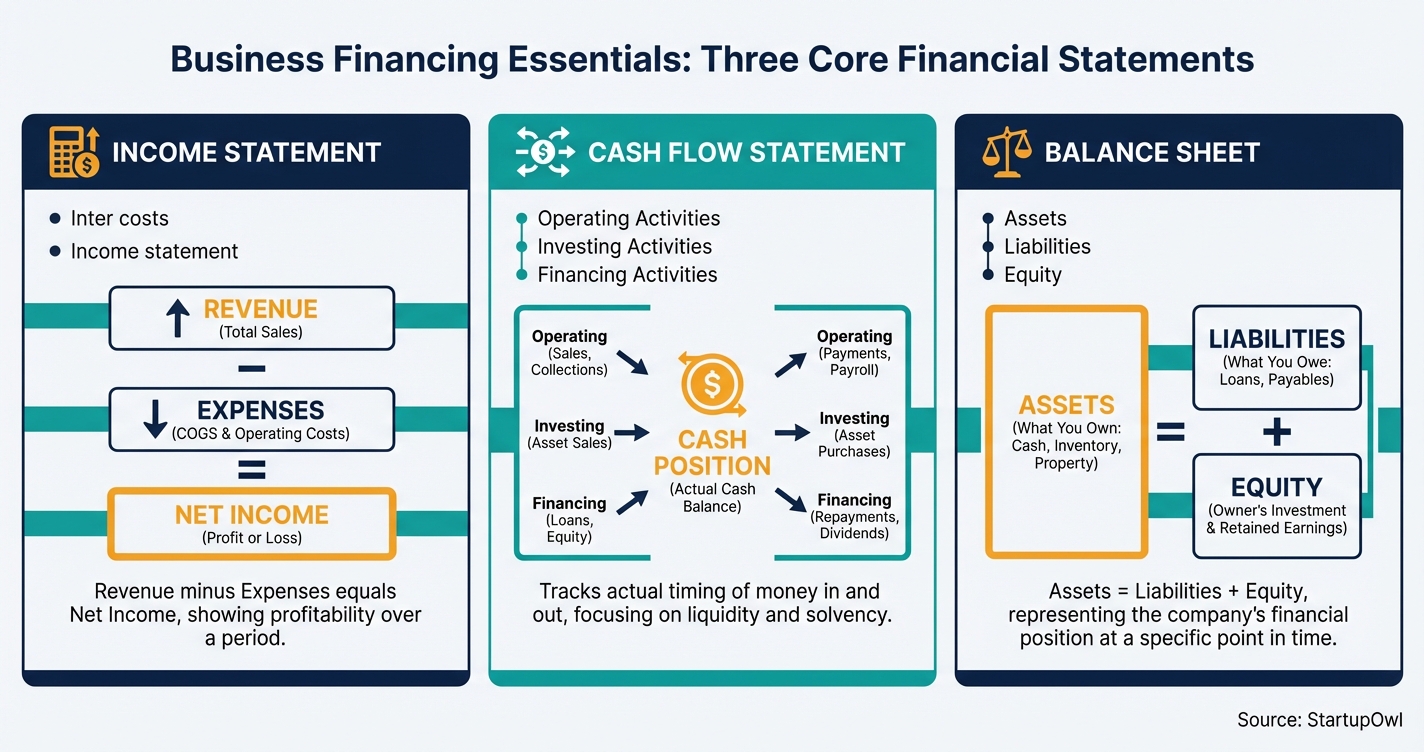
Every projection rests on three core financial statements:
- Income Statement (P&L) combines your sales forecasts with estimated expenses to calculate expected net income.
- Cash Flow Statement tracks the exact timing of money flowing in and out of your business, which is critical because profitable companies still go broke when customers pay late.
- Balance Sheet provides a snapshot of your assets, liabilities, and equity at a given point in time, following the formula Assets = Liabilities + Equity.
Beyond these three, your projections should include a sales forecast with unit volumes and pricing, an operating expense budget split into fixed and variable costs, a break-even analysis, and scenario planning covering best-case, base-case, and worst-case outcomes. The SBA recommends including forecasted statements for at least five years, with monthly or quarterly detail for year one.
Who Needs Financial Projections (and When)
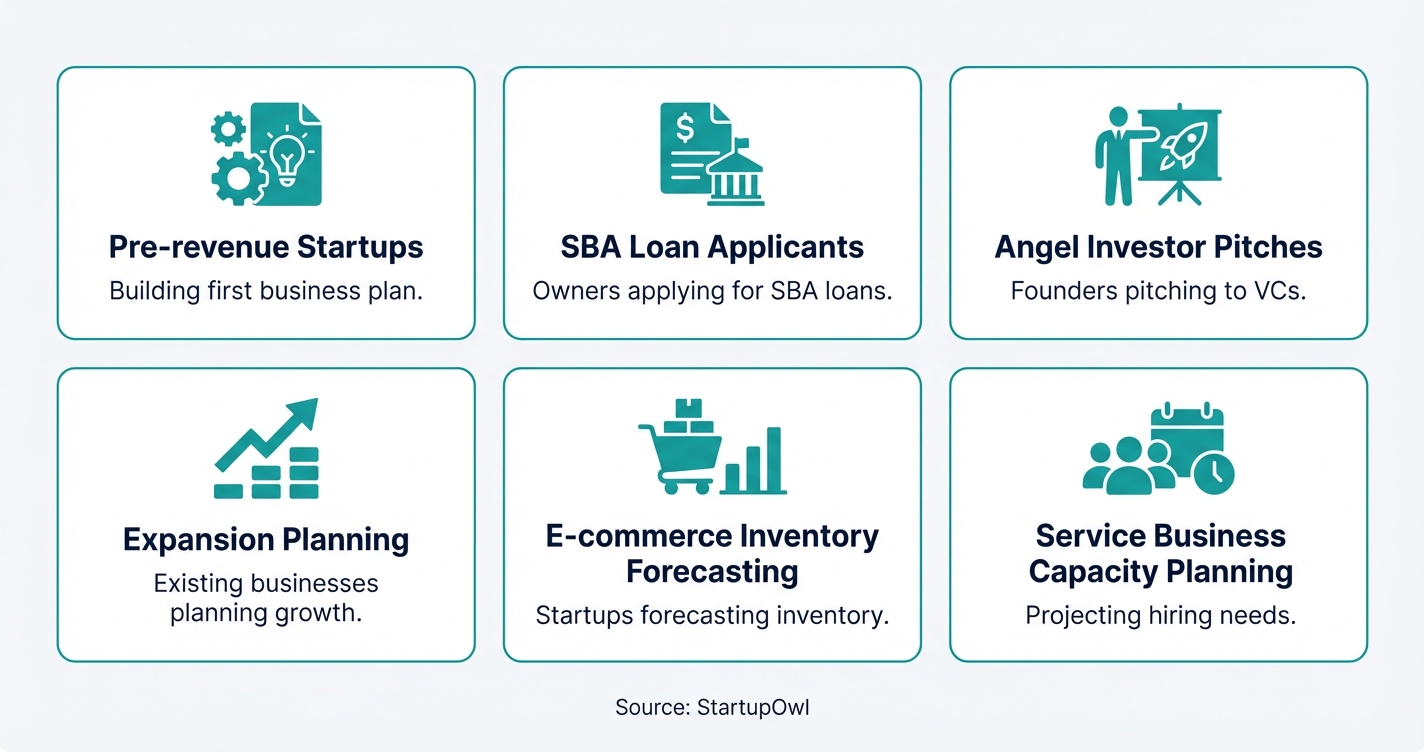
You need financial projections if you are applying for an SBA loan, pitching investors, or simply trying to figure out whether your business idea is viable. Even if you are bootstrapping, projections reveal potential cash crunches months before they happen.
If you are seeking outside financing, every bank and most investors will require a 3-year forecast that includes income statements, balance sheets, and cash flow statements. For startup business loans, lenders want to see a visible path to positive cash flow and realistic revenue assumptions grounded in market data, not aspirational targets.
Pre-revenue startups face a unique challenge. You don't have historical data to build from, so you will rely on market research, industry benchmarks, and competitor financials. Free resources from SCORE and the SBA provide templates specifically designed for businesses that don't have a financial track record yet.
Step-by-Step Process to Build Your Financial Projections
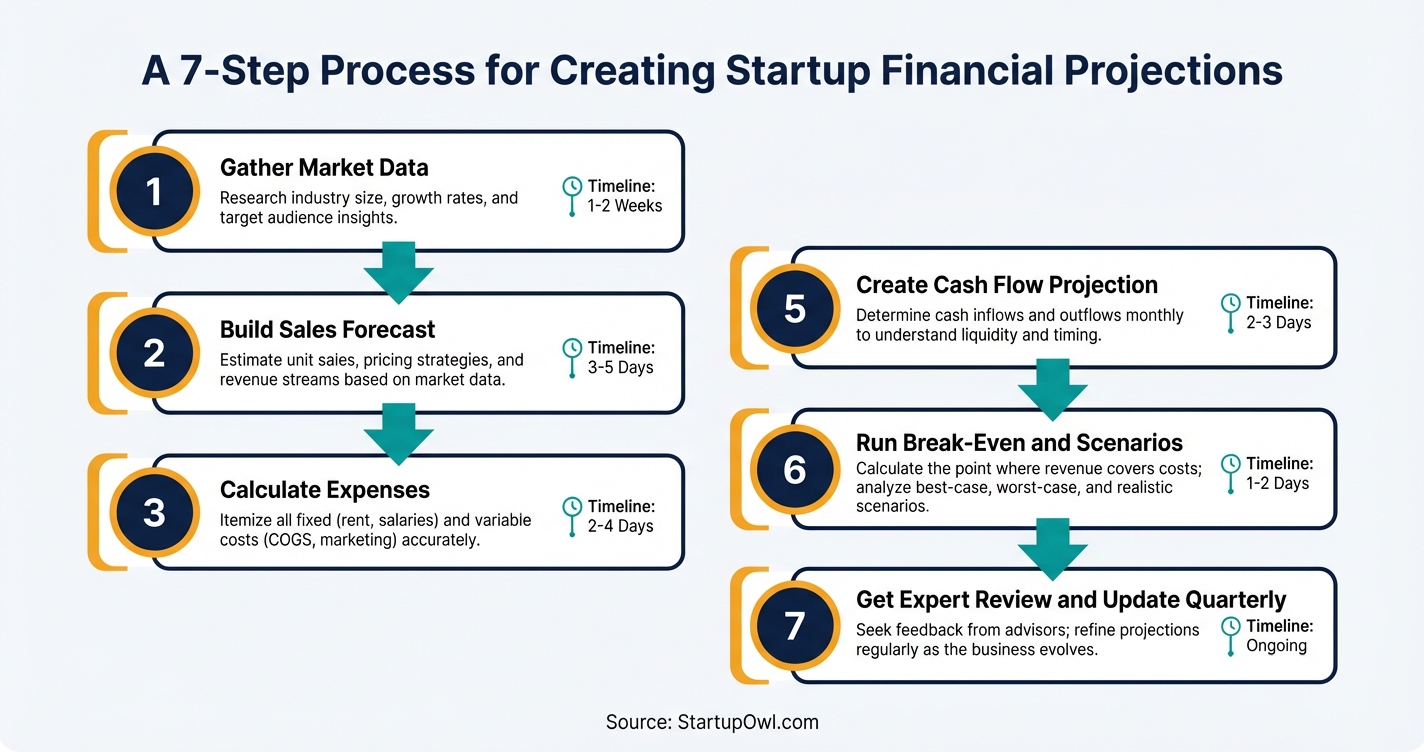
Creating financial projections involves 7 steps that build on each other. You will start with market research, move through sales and expense forecasting, assemble your three core statements, and end with scenario analysis and expert review. Plan to spend 2 to 4 weeks on the full process if this is your first time.
Your first-year projections should use monthly intervals. This granularity helps you spot short-term cash flow problems, seasonal dips, and ramp-up challenges early. For years two and three, quarterly projections are typically sufficient. The SBA and most lenders expect this level of detail.
Choose your forecasting approach based on your stage. Bottom-up forecasting (customers x average transaction value, plus costs per customer) is more credible for investor pitches because it ties to your actual go-to-market plan. Top-down forecasting (total addressable market x your realistic capture rate) is useful for early-stage validation but relies on broader industry assumptions. Many successful startups use bottom-up for years 1-2 and top-down for years 3-5.
See the detailed steps section above for the full walkthrough of each step, including costs, timelines, and the specific tools to use at each stage.
What It Costs to Create Financial Projections
You can build solid financial projections for $0 using free spreadsheet templates, or invest $20 to $42 per month in dedicated software that automates formulas and generates investor-ready reports. The biggest cost variable is whether you hire professional help to review your numbers.
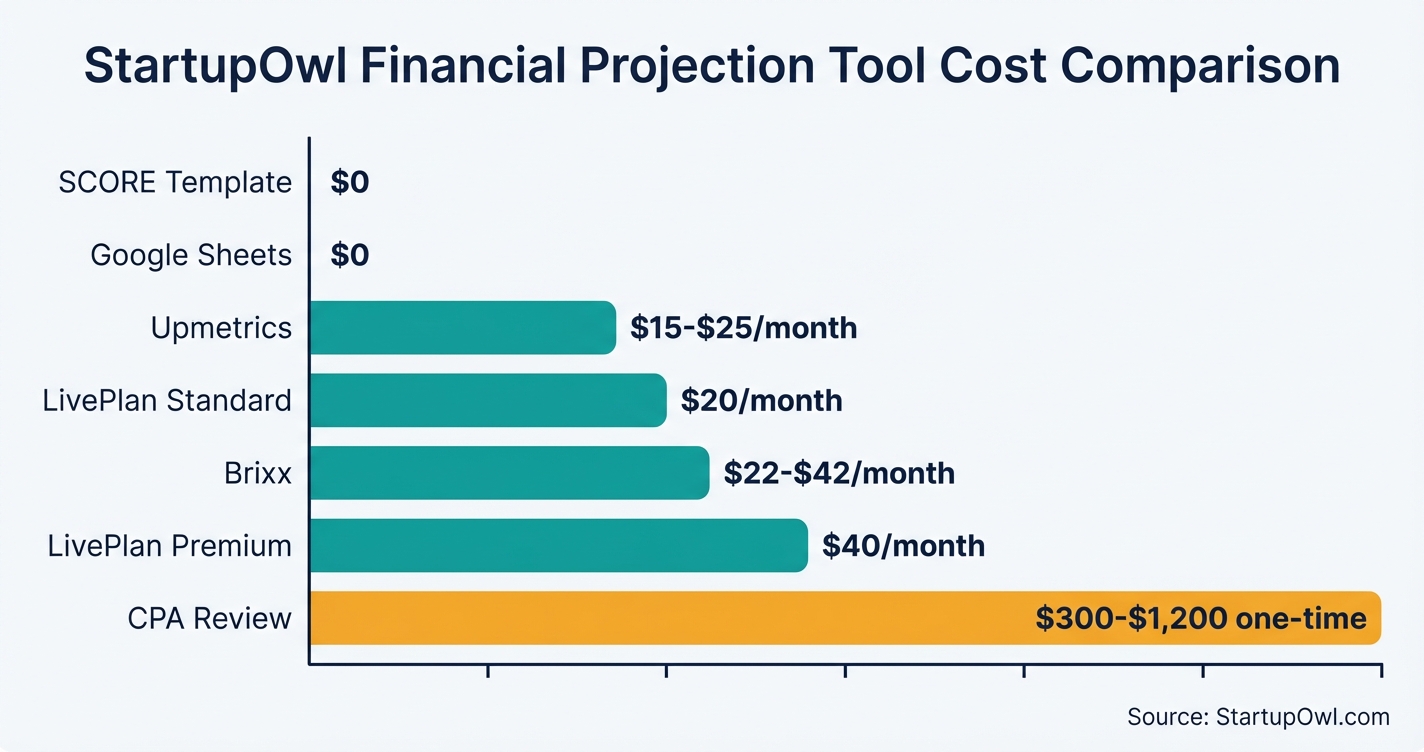
LivePlan's Standard plan costs $20/month (or $15/month billed annually) and includes automated financial statements, 500+ sample plans, and a full financial forecast builder. The Premium plan at $40/month adds benchmark data, forecast scenarios, and QuickBooks/Xero integration. Brixx starts at $22-$42/month and offers 10-year forecast windows with scenario planning.
If you want a CPA to review your projections (highly recommended before any investor pitch), expect to pay $150 to $400 per hour. A 2-3 hour review runs $300 to $1,200. Alternatively, SCORE mentors review projections for free as part of their SBA-funded advisory services. Pair good accounting software with your projection tool to keep actual vs. projected data aligned.
Financial Projection Tools and Pricing Comparison
| Type / Provider | Rate | Notes |
|---|---|---|
| Google Sheets / Excel (DIY) | $0 | Use free SCORE or Smartsheet templates. Manual formula setup required. |
| LivePlan Standard | $20/month | Automated P&L, cash flow, balance sheet. 500+ sample plans. 35-day money-back guarantee. |
| LivePlan Premium | $40/month | Adds benchmark data for 1,000+ industries, 10 forecast scenarios, QuickBooks/Xero sync. |
| Brixx | $22-$42/month | 10-year forecast window, Xero integration, scenario planning. Free 7-day trial. |
| Upmetrics | $7-$14/month | AI-powered business planning. Good for first-time founders on a budget. |
| SCORE Template | $0 | Free Excel template with built-in formulas, diagnostic checks, and depreciation schedules. |
| CPA Review (2-3 hours) | $300-$1,200 | One-time cost. Rates range from $150-$400/hour depending on location and expertise. |
Best Free Templates and Where to Download Them
You don't need to start from scratch. Several reputable organizations offer free, tested templates that include all the documents investors and lenders expect to see.
- SCORE Financial Projections Template is the gold standard for free templates. It is an Excel workbook that includes startup expenses, sales forecasts, income statements, cash flow projections, balance sheets, and break-even analysis with built-in diagnostic tools. SCORE is funded by the SBA.
- HubSpot for Startups Template provides a startup-specific financial projections template that walks you through balance sheets, income statements, and cash flow with explanations at each step.
- Smartsheet Templates offers 12-month, 3-year, and startup-specific financial projection templates in both Excel and Google Sheets formats.
- Graphite Financial offers a free startup financial model template designed for SaaS and tech startups that includes monthly breakdowns and metric tracking.
If you prefer guided software over blank spreadsheets, LivePlan automates the calculation process and connects to QuickBooks and Xero for real-time data import. It is the most popular paid option for first-time business plan creators.
What Investors Actually Look For in Your Projections
Investors are not expecting you to predict the future perfectly. They are testing your financial literacy and judgment. Here is what they zero in on:
- Realistic assumptions grounded in market data (not aspirational targets with no evidence)
- Clear unit economics showing how revenue scales with customer acquisition
- Honest expense assumptions (especially marketing and hiring, which founders chronically underestimate)
- A visible path to positive cash flow with a specific break-even timeline
- Multiple scenarios showing you have thought about downside risk
If you are applying for pre-seed funding or SBA financing, your projections need to clearly connect your business credit profile and revenue forecasts to a believable repayment or return timeline.
What to Do If You Can't Build Projections on Your Own
If spreadsheets make your eyes glaze over, you still have options. SCORE provides free one-on-one mentoring from experienced business advisors (many are retired CFOs and CPAs) who will walk you through the entire projection process. The SBA funds this program, so there is no cost to you.
A fractional CFO is another option for startups that need professional-grade projections but can't afford a full-time hire. Fractional CFOs typically charge $3,000 to $10,000 per engagement for a full financial model build-out, which includes all three statements, scenario analyses, and investor-ready formatting.
For the budget-conscious path, use a free template from SCORE, set up your business accounting in QuickBooks or Xero, and then have a SCORE mentor review your draft. This costs $0 and gets you 90% of the way to what a paid professional would deliver. If you need startup capital to hire professional help, consider microloans for small business or small business grants.
5 Projection Mistakes That Kill Funding Pitches
1. Overestimating revenue without a customer acquisition strategy. Vague forecasts destroy credibility. If you project $500K in year-one revenue but can't explain exactly how you acquire and retain each customer cohort, investors will see through it immediately. Tie every revenue number to a specific marketing channel, conversion rate, and average deal size.
2. Underestimating operating expenses. Founders consistently underplan hiring, marketing, and infrastructure costs. A common trap: projecting 3x revenue growth while only increasing marketing spend by 20%. Your expense growth needs to logically support your revenue growth.
3. Ignoring cash flow timing. Profitable on paper does not mean cash in the bank. If your customers pay on net-60 terms but you pay suppliers on net-30, you will face a 30-day cash gap every single month. Many profitable startups have failed because of this exact timing mismatch.
4. Building only one scenario. Investors know plans rarely unfold as predicted. Presenting only a best-case forecast signals inexperience. Build base, best, and worst cases by adjusting 2-3 key drivers (acquisition cost, churn rate, pricing) and show how you respond under stress.
5. Never updating your projections. Static forecasts become irrelevant within 90 days because market conditions, customer behavior, and your own execution constantly shift. Set a quarterly review cycle where you compare actuals to projections and adjust your assumptions. A business line of credit can help cover unexpected cash gaps while you adjust.
How to Structure Your Projection Template for Maximum Impact
Follow these structural best practices to make your projections clear and professional:
- Lead with a single-page financial summary before the detailed backing sheets. Investors scan the summary first; if it doesn't make sense, they won't read deeper.
- Use separate tabs for Sales Revenue, Operating Expenses, Income Statement, Cash Flow, and Balance Sheet.
- Label all assumption cells clearly (highlight them in yellow or blue) so reviewers instantly understand what drives each projection.
- Include visual charts showing revenue growth, cash flow trajectory, and break-even timeline on the summary page.
- Add scenario tabs for base-case, best-case, and worst-case outcomes so investors can toggle between views.
Step-by-Step Process
- 1
Gather your market research and historical data
Start by collecting every piece of financial data you have (tax returns, bank statements, early sales records). If you are pre-revenue, pull industry benchmarks from sources like the U.S. Census Bureau, IBISWorld, or trade association reports.
Define your key assumptions in a separate document. Write down your estimated year-over-year revenue growth rate, customer acquisition cost, and average transaction value. Labeling your assumptions clearly is critical because investors will challenge every single one.
Tips
- Use Census.gov and BLS.gov for free industry data, market size, and growth trends.
- Document every assumption in a dedicated spreadsheet tab so stakeholders can see what drives your numbers.
- Compare your assumptions against at least 2-3 competitors or comparable businesses in your market.
Common Mistakes
- Skipping competitor benchmarking and relying only on gut-feel revenue estimates.
- Failing to write down assumptions, making it impossible to explain your projections to investors later.
- 2
Build your sales forecast
Your sales forecast should project monthly revenue for the first 12-18 months, then quarterly for years 2 and 3. Most lenders and investors want a 3-year sales forecast in your business plan. Include unit volumes, price per unit, and expected customer count.
Choose between top-down forecasting (total addressable market multiplied by your realistic capture rate) and bottom-up forecasting (customers x average transaction value). Bottom-up is more credible for investor pitches because it ties directly to your go-to-market strategy.
Tips
- Use bottom-up forecasting for years 1-2 and top-down for years 3-5 to balance specificity with market context.
- Include your customer acquisition cost (CAC) and conversion rates so sales numbers tie directly to your marketing spend.
Common Mistakes
- Projecting a 'hockey stick' revenue curve without explaining the specific growth triggers that cause the spike.
- Ignoring seasonality and assuming flat monthly sales across the year.
- 3
Calculate your operating expenses
Break your expenses into two categories: fixed costs (rent, salaries, insurance) and variable costs (materials, shipping, advertising). Include your cost of goods sold (COGS) as a separate line item since it directly impacts your gross margin.
Don't forget one-time startup costs like incorporation fees, equipment purchases, and website development. These often add $5,000-$25,000 or more in the first quarter alone.
Tips
- Start with fixed costs like rent and utilities since these are easiest to estimate, then layer in variable costs.
- Factor in hiring plans with fully loaded costs (salary + benefits + payroll taxes), which typically add 20-30% on top of base salary.
Common Mistakes
- Underestimating marketing and customer acquisition expenses relative to your growth targets.
- Omitting professional service costs like legal, accounting, and insurance that add up quickly.
- 4
Project your income statement and balance sheet
Your income statement (also called a P&L) calculates projected net income by subtracting total expenses from total revenue. The balance sheet shows your assets, liabilities, and owner's equity at a specific point in time, following the equation: Assets = Liabilities + Equity.
For your first year, break the income statement down month by month. For years 2-3, quarterly projections are typically sufficient unless you are in a high-growth phase. Calculate your gross margin (revenue minus COGS) to show investors your unit economics.
Tips
- Use the SCORE free financial projections Excel template, which includes built-in formulas and diagnostic tools to check your numbers.
- Calculate gross margin as a percentage; investors expect to see this front and center.
Common Mistakes
- Mixing up revenue recognition and cash received, which creates a misleading picture of profitability.
- 5
Create your cash flow projection
Your cash flow projection tracks the actual timing of money moving in and out. This is the single most important document for early-stage survival. A business can be profitable on paper but still run out of cash if customers take 30-60 days to pay invoices.
Model three categories: operating activities (daily business), investing activities (equipment, long-term purchases), and financing activities (loans, equity infusions). Project on monthly intervals for at least the first 12 months.
Tips
- Keep a cash reserve equal to at least 90 days of operating expenses to handle unexpected shortfalls.
- Build in realistic payment delays (net-30 or net-60) from your customers rather than assuming immediate payment.
Common Mistakes
- Treating the income statement profit as actual cash in the bank, which it is not.
- Not accounting for the timing gap between when you pay suppliers and when customers pay you.
- 6
Run break-even and scenario analyses
Your break-even point is the sales volume where revenue exactly covers all costs. The formula is: Fixed Costs / (Price per Unit minus Variable Cost per Unit). This number tells investors exactly how many units or customers you need to survive.
Build three scenarios (base case, best case, worst case) by adjusting key drivers like customer acquisition cost, churn rate, and price point. Ask yourself: what happens if sales are 20% lower than expected? What if your main supplier raises prices 15%?
Tips
- Show all three scenarios to investors since it demonstrates financial maturity and realistic thinking.
- Stress-test your cash flow under the worst-case scenario to see how many months of runway you actually have.
Common Mistakes
- Only building one optimistic forecast and ignoring downside scenarios entirely.
- 7
Get expert feedback and update quarterly
Have an accountant or CPA review your assumptions and projections before sharing them with investors or lenders. CPA hourly rates typically range from $150 to $400, but a few hours of expert review can prevent embarrassing errors in your pitch deck. Free SCORE mentors also review projections at no cost.
Your projections are living documents. Update them at least quarterly (monthly if you are pre-revenue or high-growth) as actual performance data replaces assumptions. Compare actuals against your forecasts to measure accuracy and improve future projections.
Tips
- SCORE mentors are free and experienced; many are retired CFOs and CPAs who review projections regularly.
- Track your forecast accuracy month-over-month and adjust assumptions based on real performance data.
- Update projections every time you have a major business event (new product launch, big contract win, staffing change).
Common Mistakes
- Treating projections as a one-time document that lives in a drawer after your pitch meeting.
- Never comparing actual results to forecasts, which means you never learn where your assumptions were wrong.
Cost Breakdown
| Item | Cost Range | Notes |
|---|---|---|
| Google Sheets or Excel (DIY template) | $0 | Free templates available from SCORE, Smartsheet, and HubSpot. Requires manual formula setup. |
| LivePlan (Standard plan) | $20/month | Automated financials, 500+ sample plans, step-by-step guidance. Premium plan is $40/month. |
| Brixx (financial modeling software) | $22-$42/month | 10-year forecast window, scenario planning, Xero/QuickBooks integration. Free 7-day trial available. |
| CPA or accountant review | $150-$400/hour | Expect to pay for 2-4 hours of review time ($300-$1,600 total). Flat-fee engagements may be $500-$1,500. |
| SCORE mentor review | $0 | Free mentoring from experienced business advisors funded by the SBA. Available in-person and virtually. |
Frequently Asked Questions
Most investors and lenders want to see 3 to 5 years of projections. Your first year should be broken into monthly detail, while years 2-5 can use quarterly or annual intervals. The SBA recommends a prospective financial outlook for at least five years.
Yes. Pre-revenue startups use market research, industry benchmarks, and competitor data to build assumption-driven projections. The SCORE template is designed for exactly this situation. Document every assumption clearly so investors understand the logic behind your numbers.
The SCORE Financial Projections Template is the most comprehensive free option. It is an Excel workbook that covers startup expenses, sales forecasts, income statements, cash flow projections, balance sheets, break-even analysis, and includes built-in diagnostic tools. It is funded by the SBA.
Update your projections at least quarterly. If you are pre-revenue or in a high-growth phase, monthly updates are better. Compare your actual results to your forecast each period and adjust assumptions accordingly. Static projections lose relevance within about 90 days.
No, but having one review your work is highly recommended, especially before an investor pitch. CPA review costs $300 to $1,200 for 2-3 hours of work. A free alternative is to work with a SCORE mentor, many of whom are experienced financial professionals.
Top-down starts with total market size and estimates your capture percentage. Bottom-up builds from your unit economics (customers x price, minus per-customer costs). Bottom-up is more credible for investor pitches. Many startups use bottom-up for years 1-2 and top-down for years 3-5.
This content is for informational purposes only and does not constitute financial, legal, or tax advice. Business financing terms, rates, and eligibility vary by lender, credit profile, and business characteristics. Consult a licensed financial advisor or CPA before making borrowing decisions. Software pricing and CPA rates reflect published data as of 2026 and may change without notice.
Sources & References
- SCORE Financial Projections Template
- SBA: Write Your Business Plan
- US Chamber of Commerce: Creating a Financial Forecast for Your Startup
- HubSpot for Startups: Financial Projections Template
- Shopify: Create Financial Projections for Your Business Plan (2026)
- LivePlan Pricing
- Brixx Pricing
- Smartsheet: Free Financial Projection Templates
- Graphite Financial: Financial Projections for Startups
- SVB: Financial Forecasting for Startups
About the Author
Senior Finance & Banking Editor
Richard is the veteran anchor of the site's financial content. Raised in the Midwest and starting his career in Chicago's commercial banking sector, he spent over a decade underwriting small business loans before moving into financial journalism. He doesn't get swept up in startup hype; he cares about unit economics, APYs, and fee structures.
Was this article helpful?
Questions about How to Create Financial Projections for a Startup
4 comments
Carmen R.
July 27, 2026
Is a simple spreadsheet template fine for investors or do they expect something fancier?
Richard MooreStartupOwl team
Senior Finance & Banking Editor · July 29, 2026
A clean spreadsheet is the standard, three statements or even just a monthly revenue and cash model for early stages. What reads as fancy to investors is not formatting, it is clearly labeled assumptions they can change and watch flow through.
Nils
July 6, 2026
for a pre revenue startup what do you even project, it feels like inventing numbers
Richard MooreStartupOwl team
Senior Finance & Banking Editor · July 10, 2026
You are not inventing numbers, you are documenting assumptions. Bottom up beats top down, price times realistic customers acquired per channel per month, with the acquisition assumptions visible. Investors read projections to see how you think, the assumptions ARE the deliverable.
Leave a comment